The original brief sounded simple: show compressor degradation and predict maintenance. The difficult part was deciding which conclusions the data could actually support. I worked across reconciled thermodynamics, auxiliary mechanical channels, maintenance references, Excel lineage, feature pipelines, APIs, and operator-facing views.
Instead of optimizing a single opaque score, I built an evidence hierarchy. Fouling uses variables with direct thermodynamic meaning. Surge-oriented work uses different evidence contracts for each plant. Forecasts, thresholds, and maintenance resets are promoted only when their validation gates pass.
- My role: diagnostic design, data forensics, thermodynamic feature engineering, validation, backend integration, and dashboard implementation.
- Scientific boundary: daily historian exports can rank review candidates; they do not confirm aerodynamic surge without controller, map, or high-frequency evidence.
- Privacy boundary: this page contains aggregate methodology only. Raw plant data, operational tags, and internal source artifacts are not published.
From Historian Data to Reviewable Evidence
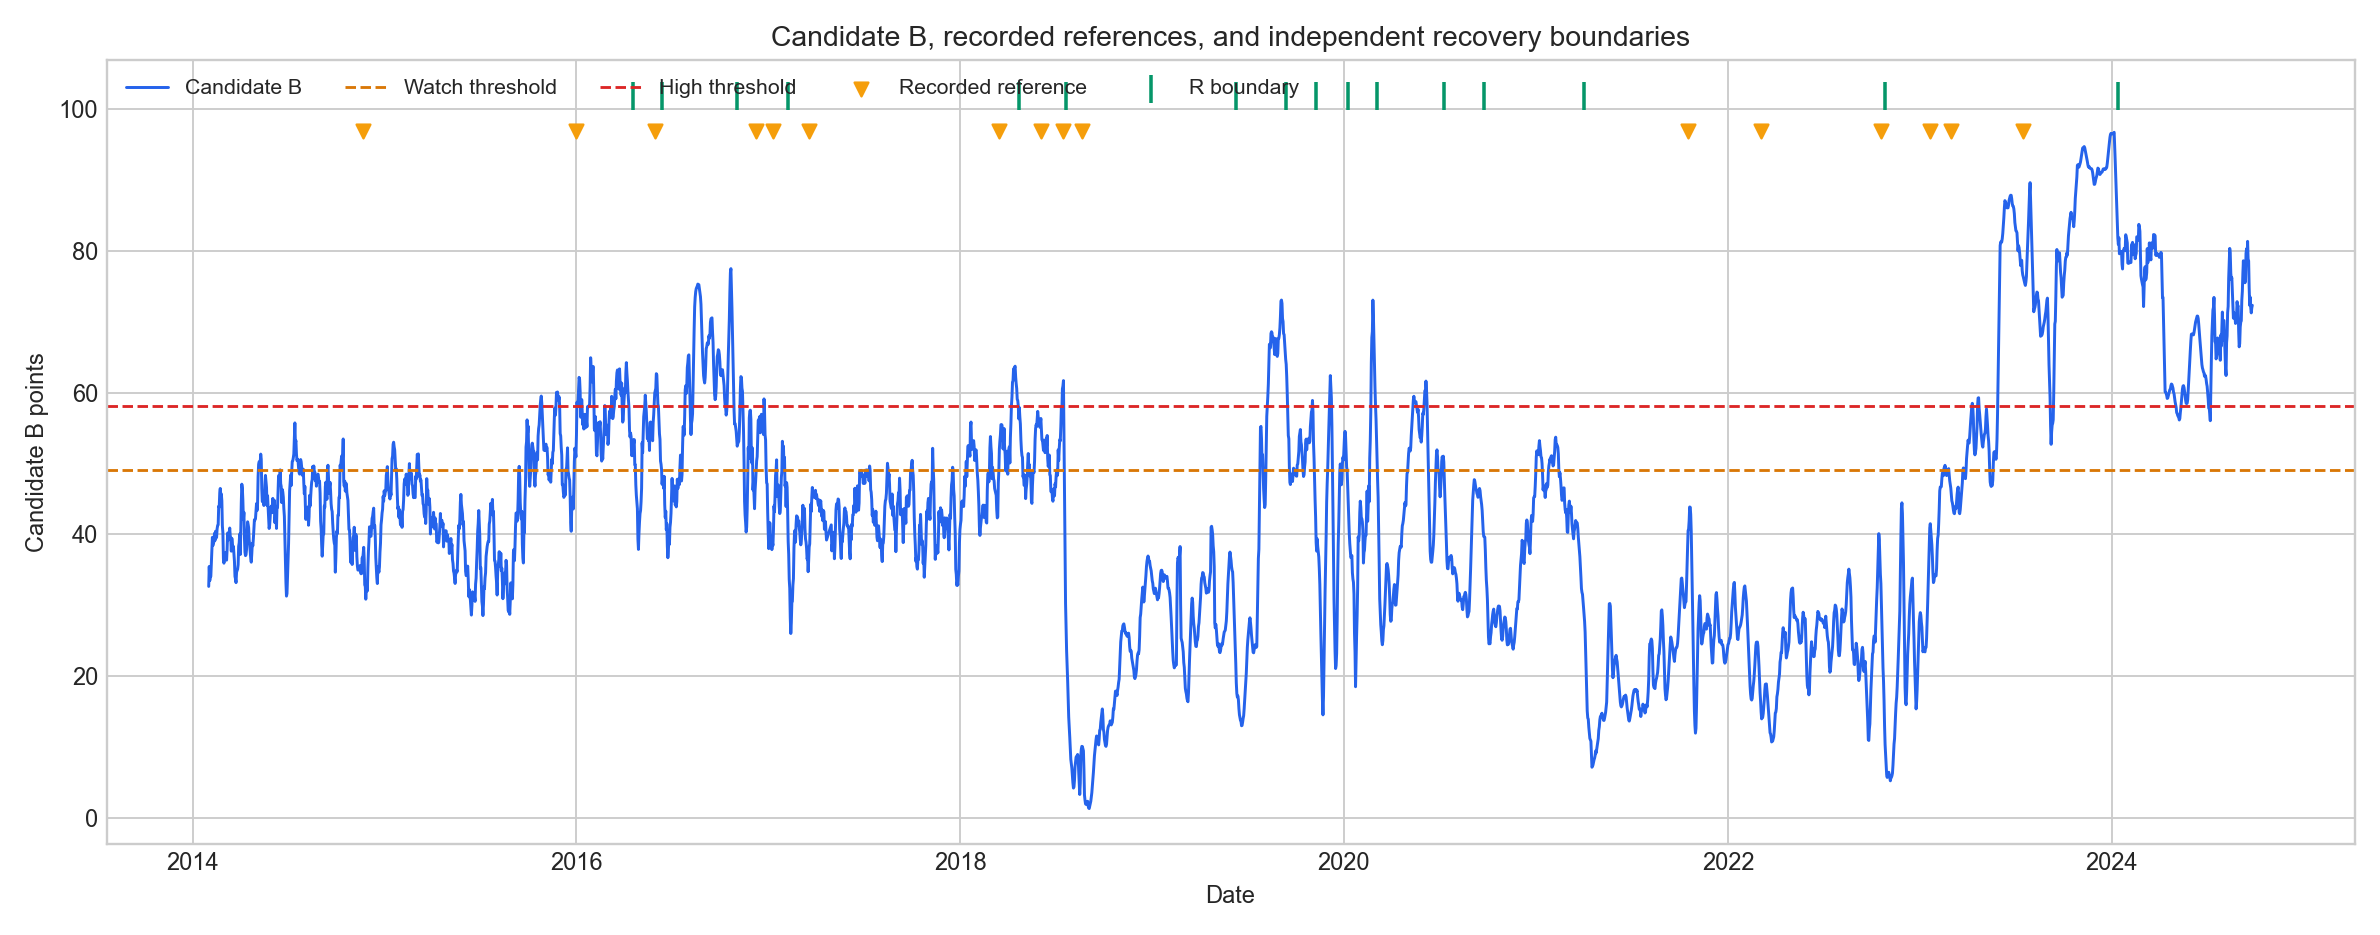
Plant 2 Candidate B combines reconciled polytropic-efficiency loss and temperature-rise penalties across all four stages, with prior-only operating envelopes and fixed development scaling.
Forecast enablement, maintenance labels, threshold use, and surge wording are protected by configuration, frozen artifacts, validators, and regression tests.
The Most Useful Results Were Not Always Promotions
Rebuilt Plant 2 fouling from first principles
Audited each reconciled variable for monotonic degradation, stability, noise, and maintenance recovery. The selected shadow formulation reproduced 3,879 historical rows with maximum absolute difference below 1e-10.
Candidate B = stage efficiency loss + temperature-rise penalty
Rejected forecasts that looked plausible but failed gates
Rolling-origin tests covered classical, tree-based, physics-guided, and KNN approaches. Holt damped trend remained the numerical winner, but the evidence was too weak for maintenance decisions because the holdout contained only one effective maintenance event.
Decision: preserve monitoring; keep forecast policy disabled
Separated anomaly context from surge confirmation
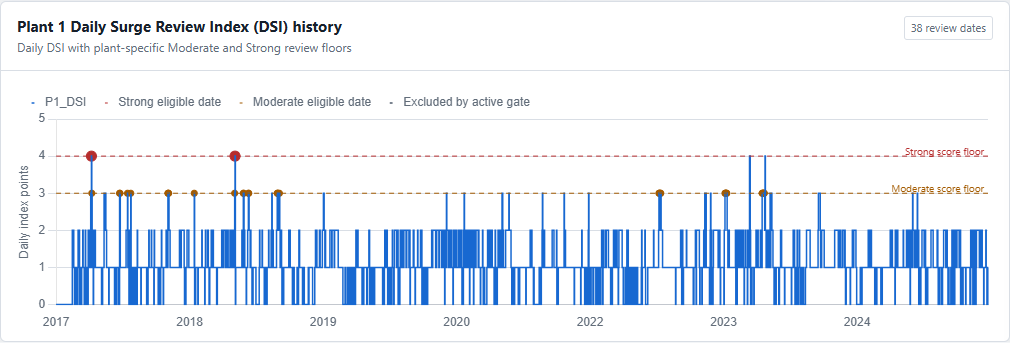
A full historian audit found different observability at each plant. I replaced one shared detector with three plant-specific review contracts and renamed the continuous context layer so it did not imply physical distance to an OEM surge line.
Review candidate ≠ confirmed surge event
Cross-verified newly supplied wash-oil histories
Causal 21-day baselines, multi-wheel consensus, persistent restoration, and independent DFI recovery identified three complete dosing cycles. Only one cycle had sufficient thermodynamic corroboration, so it was promoted as event context without triggering an automatic DFI reset.
3 complete cycles → 1 corroborated context event → 0 automatic resets
The Interface Shows the Signal and Its Scientific Boundary
These diagnostic traces show two different analytical roles. Candidate B visualizes thermodynamic fouling evidence and recovery behavior. The instability index ranks dates for engineering review; it does not confirm aerodynamic surge.
One Platform, Three Scientific Contracts
| Plant | Available evidence | Legitimate output | Claim boundary |
|---|---|---|---|
| Plant 1 | Flow, pressure ratio, speed, four vibration channels, two thrust probes | Mechanical-aerodynamic review ranking | Engineering review only |
| Plant 2 | Stage flow and pressure, twelve compressor vibration channels, four displacement probes | Stage-consensus review ranking | Units and repaired lineage remain explicit |
| Plant 3 | Flow, pressure, temperature, power | Thermodynamic operating excursion | No mechanical surge claim |
What This Project Demonstrates
Optimizing against unreliable labels
Maintenance dates, thermodynamic recovery boundaries, and index responses did not consistently align.
Separated three layers of truth
Recorded references, physical recoveries, and verified maintenance methods are retained independently, preventing label noise from silently steering the model.
One model across unlike plants
Sensor availability, units, operating ranges, and mechanical coverage differ materially.
Plant-specific contracts
No shared cross-plant threshold is allowed. Each output is named and scored according to the evidence that plant can actually provide.
A polished graph can overstate certainty
Forecast and anomaly curves can look authoritative even when validation evidence is sparse.
UI-level scientific boundaries
Diagnostic labels, disabled decision coupling, rejection reasons, and evidence details remain visible next to the visualization.